Cambridge, ON – For many homeowners, carpet odours are a frustrating challenge that can affect the entire atmosphere of a living space. Whether it’s pet-related, food-based, or the slow build-up of moisture and dust, lingering smells are hard to ignore. That’s why KCS Kitchener Cleaning Services, a leading residential cleaning company serving the Kitchener-Waterloo and Guelph area, has published an informative guide that tackles the commonly searched question: “What is the best thing to deodorize carpets with?”
The article, titled “What is the Best Thing to Deodorize Carpets With?” dives deep into practical and affordable options homeowners can use to freshen up their carpets using common household items, with insights rooted in years of professional cleaning experience.
Expert Solutions from a Trusted Local Brand: The KCS team begins the article with one of the most time-tested and reliable methods: baking soda. Known for its ability to neutralise both acidic and basic odours, baking soda is a natural and pet-safe option that homeowners can use as often as needed. The guide outlines the simple process: sprinkle, wait overnight, and vacuum thoroughly.
Also featured is a vinegar and water solution, praised for its ability to neutralise odour-causing bacteria without adding artificial scents or residue. The article encourages the use of natural, non-toxic solutions wherever possible, an approach that aligns with KCS’s environmentally conscious values.
For readers seeking a fragrant boost, KCS recommends pairing baking soda with essential oils such as lavender, lemon, and eucalyptus. These oils not only deodorise but create an uplifting ambience in the home. Lavender promotes calm, lemon brightens the room, and eucalyptus adds both freshness and antimicrobial benefits.
Quick fixes, such as carpet deodorising powders, are covered for convenience, while steam cleaning with a deodoriser and professional carpet cleaning services are recommended for deep or persistent odours.
Founded and located in Cambridge, Ontario, KCS Kitchener Cleaning Services is more than just a cleaning company; it’s a local, family-run business built on trust, consistency, and exceptional care. With a name inspired by the rich heritage of Kitchener, the company is represented by the historic clock tower in Victoria Park, a symbol of reliability and community roots.
The team at KCS is passionate about helping homeowners enjoy healthier, happier spaces. “While we don’t offer carpet shampooing or steam cleaning, we believe a fresh-smelling home begins with cleanliness at every level,” says the founder, who built KCS with a focus on eco-friendly solutions and client satisfaction. “That’s why our detailed services are designed to elevate the overall freshness and comfort of your home.”
KCS specialises in General Cleaning, Deep Cleaning, Pet-Friendly Cleaning, Move-In/Move-Out Cleaning, and Post-Construction Cleaning. The company exclusively uses hypoallergenic microfiber cloths and eco-conscious cleaning products that are safe for kids and pets.
With a 5-star average rating from local clients and a 100% satisfaction guarantee, KCS has established itself as a trusted name among residents across Kitchener, Waterloo, Cambridge, and Guelph.
Established in 2022, KCS Kitchener Cleaning Services is a locally owned and family-operated business located in Cambridge, Ontario. The company serves the communities of Kitchener, Waterloo, Cambridge, and Guelph, offering eco-friendly, high-detail cleaning services for homes, condos, apartments, and commercial spaces. Their team of trained professionals is known for showing up on time, using hypoallergenic and pet-safe products, and delivering a 100% satisfaction guarantee.
While carpet shampooing and steam cleaning are not part of their service menu, KCS specialises in general, deep, move-in/move-out, post-construction, and pet-friendly cleaning solutions. With easy online booking, mobile app scheduling, and free estimates, KCS makes maintaining a clean home simpler than ever.
SAN FRANCISCO, CA – Aug 12, 2025 Wanderboat AI, a forward-thinking travel technology company, today announced the official launch of its groundbreaking Hotel Listicles and integrated Booking service. This new platform is engineered to resolve a critical point of friction in the digital travel industry: the overwhelming paradox of choice that paralyzes consumers. By leveraging a sophisticated combination of artificial intelligence, natural language processing, and expert human curation, Wanderboat AI is setting a new standard for how travelers discover, evaluate, and book accommodations online.
The current online travel agency (OTA) landscape often inundates users with thousands of unfiltered options, leading to decision fatigue and a lack of confidence. Wanderboat’s platform directly confronts this challenge. It moves beyond traditional keyword-based filters and allows users to articulate their needs conversationally. A user can simply search for “quiet boutique hotels in Kyoto for a honeymoon” or “find local hotels in Austin with live music nearby,” and the platform’s AI interprets the intent to generate a concise, relevant, and high-quality listicle of recommendations. This innovative approach transforms a tedious research task into an intuitive and efficient discovery process.
At the core of Wanderboat’s technology is a proprietary system that analyzes vast amounts of data, including verified guest feedback, amenity lists, location relevance, and pricing trends. However, the platform’s key differentiator lies in its hybrid model. AI-driven results are further refined and validated by a team of seasoned travel experts. These experts provide qualitative insights that algorithms alone cannot capture, such as the ambiance of a hotel, the quality of its service, or its authentic connection to local culture. This ensures that every hotel featured in a listicle not only meets quantitative benchmarks but also offers a genuinely superior guest experience, effectively helping users find the best hotels for their specific needs.
“The digital travel space is ripe for disruption. For too long, innovation has focused on aggregation rather than curation, leaving travelers to do the hard work of vetting and validation,” said You Wu, Founder and CEO of Wanderboat AI. “At Wanderboat, we are fundamentally changing that dynamic. Our technology is built to understand nuance and intent, delivering personalized results that inspire trust. By integrating intelligent curation with a powerful hotel booking aggregator, we are not just building a better search tool; we are creating a more intelligent and user-centric ecosystem for the future of travel planning.”
The integrated hotel booking service is a testament to this vision of a seamless user journey. After selecting a hotel from a curated listicle, travelers are presented with a comprehensive meta-search engine that aggregates prices and room options from various providers. This transparency ensures users can find the best value. Uniquely, the platform’s AI also generates a curated list of nearby activities and experiences, transforming the hotel from just a place to stay into a hub for local discovery. While users are redirected to the provider’s site to finalize payment, Wanderboat’s value lies in centralizing the entire decision-making process—from personalized discovery and reading hotel reviews to price comparison and activity planning—into one intelligent, cohesive interface.
Based in the innovation hub of San Francisco, California, Wanderboat AI is fundamentally a mission-driven company dedicated to making travel planning intuitive, personal, and efficient. The launch of the Hotel Listicles and Booking service is the first major milestone in a broader vision to build a comprehensive, AI-powered travel ecosystem. The company’s philosophy is rooted in the powerful synergy between advanced artificial intelligence and irreplaceable human insight. This combination allows Wanderboat to move beyond simple data aggregation and into the realm of genuine, trustworthy recommendations. By transforming complex research into a simple and enjoyable conversation, the platform aims to cover the entire travel journey, from accommodations and activities to dining and transportation. Wanderboat AI is committed to continuously evolving its technology to anticipate and meet the sophisticated needs of modern travelers, ultimately positioning itself as an indispensable partner in crafting memorable journeys worldwide.
NORTH BILLERICA, MA / ACCESS Newswire / August 12, 2025 / Tecogen Inc. (NYSE American:TGEN), a leading manufacturer of clean energy products, reported revenues of $7.29 million and net loss of $1.47 million for the quarter ended June 30, 2025 compared to revenues of $4.73 million, and a net loss of $1.54 million in 2024. Our cash and cash equivalents balance was $1.64 million at June 30, 2025.
Abinand Rangesh, CEO of Tecogen, commented that “since our last earnings call we have made tremendous progress with our data center strategy and achieved several key milestones. We received our first LOI for a great pilot project. This is for a 100+MW data center with the potential to be a 500+MW site. The customer expects to evaluate 6 STx chillers during the first phase of the project. If successful, more chillers will be used in subsequent phases. We expect the LOI to convert to a PO later this year and we hope to grow with this customer.
In the last three months, our marketing has generated great leads. We have now quoted two projects for 60 to 100 chillers each. We have multiple other projects that are earlier stage but have similar potential. We’ve also received feedback on how customers are making purchasing decisions. During the call, I will address what these are and the steps we are taking so we can convert these leads into orders.
The only setback this quarter was the reduction in the gross profit margin which drove the net loss. Product margin was lower because we started shipping the hybrid air-cooled chiller. As expected, the first few units had higher costs due to low volume material purchasing and as our team gained experience building the product. We expect the hybrid chiller margin to increase with volume production. The other products shipped this quarter had similar margins as previous quarters.
Overall service margin declined because of one region – Manhattan and NJ. This was in part due to bulk oil system upgrades for our InVerde fleet. This has a short term impact on profitability but increases service intervals by 150% to 200%. We also experienced increased overtime hours. During the call, we will discuss the new protocols we have implemented to restore this territory to profitability.
Given the size of potential projects, the ability to manufacture and ship significant volumes of chillers is critical. We have hired talent in manufacturing and engineering. The additional staffing was a significant factor in our increased operating expenses, which increased by 9% in Q2 2025 compared to last year. To provide the necessary capital to scale our business, we also raised $18.2 million in July. The capital raised will be used to increase factory output and for marketing. I will share more details on the data center projects, Vertiv and scale up plan tomorrow.”
Key Takeaways
Net Loss and Earnings Per Share
Net loss for the quarter ended June 30, 2025 was $1.46 million compared to a net loss of $1.54 million for the same period of 2024, a decrease of $0.07 million, due to increased gross profit from our Products and Services segments. EPS for the quarter ended June 30, 2025 and 2024 was a loss of $(0.06)/share, respectively.
Net loss for the six months ended June 30, 2025 was $2.12 million compared to a net loss of $2.64 million for the same period of 2024, a decrease of $0.52 million, due to increased gross profit from our Products and Services segments. EPS for the six months ended June 30, 2025 and 2024 was a loss of $(0.08)/share and $(0.11)/share, respectively.
Loss from Operations
Loss from operations for the quarter ended June 30, 2025 was $1.41 million compared to a loss from operations of $1.47 million for the same period in 2024, a decrease of $0.06 million, due to increased gross profit from our Products and Services segments.
Loss from operations for the six ended June 30, 2025 was $2.01 million compared to a loss from operations of $2.52 million for the same period in 2024, a decrease of $0.52 million, due to increased gross profit from our Products and Services segments.
Revenues
Revenues for the quarter ended June 30, 2025 were $7.29 million compared to $4.73 million for the same period in 2024, a 54.3% increase.
Products revenues in the quarter ended June 30, 2025 were $3.16 million compared to $0.12 million for the same period in 2024, an increase of 2,536.6%. The increase in revenue during the quarter ended June 30, 2025 is due to increased chiller and cogeneration revenue, which included the initial deliveries of our hybrid-drive air-cooled chiller.
Services revenues in the quarter ended June 30, 2025 were $3.97 million, compared to $4.13 million for the same period in 2024, a decrease of 3.9% due to decreased revenues from the acquired Aegis maintenance contracts.
Energy Production revenues in the quarter ended June 30, 2025 were $0.17 million compared to $0.48 million for the same period in 2024, a decrease of 63.8%. The decrease in Energy Production revenue is due to contract expirations at certain energy production sites in late 2024 and the temporary shutdown of a few energy production sites for repairs.
Revenues for the six months ended June 30, 2025 were $14.57 million compared to $10.91 million for the same period in 2024, a 33.5% increase.
Products revenues in the six months ended June 30, 2025 were $5.69 million compared to $1.61 million for the same period in 2024, an increase of 253.1%. The increase in revenue during the six months ended June 30, 2025 is due to increased chiller and cogeneration revenue, which included the initial deliveries of our hybrid-drive air-cooled chiller.
Services revenues in the six months ended June 30, 2025 were $8.21 million, compared to $8.14 million for the same period in 2024, an increase of 0.9% due to increased revenues from existing contracts, offset by decreased revenues from the acquired Aegis maintenance contacts.
Energy Production revenues in the six months ended June 30, 2025 were $0.67 million compared to $1.16 million for the same period in 2024, a decrease of 42.1%. The decrease in Energy Production revenue is due to contract expirations at certain energy production sites in late 2024 and the temporary shutdown of a few energy production sites for repairs.
Gross Profit
Gross profit for the quarter ended June 30, 2025 was $2.46 million compared to $2.08 million in the same period in 2024. Gross margin decreased to 33.8% in the quarter ended June 30, 2025 compared to 44.0% for the same period in 2024. The decrease in gross margin was due to higher material and labor costs in our Products and Services segments in the quarter ended June 30, 2025.
Gross profit for the six months ended June 30, 2025 was $5.68 million compared to $4.65 million in the same period in 2024. Gross margin decreased to 39.0% in the six months ended June 30, 2025 compared to 42.7% for the same period in 2024. The decrease in gross margin was due to higher material and labor costs in our Products and Services segments in the the six months ended June 30, 2025.
Operating Expenses
Operating expenses increased $0.32 million, or 9.0%, to $3.87 million in the quarter ended June 30, 2025 compared to $3.55 million in the same period in 2024, due to increased payroll, benefits, recruitment costs, and sales commissions.
Operating expenses increased $0.51 million, or 7.1%, to $7.69 million in six months ended June 30, 2025 compared to $7.18 million in the same period in 2024, due to increased payroll, benefits, recruitment costs and sales commissions.
Adjusted EBITDA
Adjusted EBITDA was negative $1.16 million for the quarter ended June 30, 2025 compared to negative $1.30 million for the quarter ended June 30, 2024. For the six months ended June 30, 2025, adjusted EBITDA was a negative $1.54 million compared to a negative $2.19 million for the six months ended June 30, 2024. (Adjusted EBITDA is defined as net income or loss attributable to Tecogen, adjusted for interest, income taxes, depreciation and amortization, stock-based compensation expense, unrealized gain or loss on investment securities, goodwill impairment charges and other non-cash non-recurring charges or gains including abandonment of intangible assets and asset impairment. See the table following the Condensed Consolidated Statements of Operations for a reconciliation from net income (loss) to Adjusted EBITDA, as well as important disclosures about the Company’s use of Adjusted EBITDA).
Conference Call Scheduled for August 13, 2025, at 9:30 am ET
Tecogen will host a conference call on August 13, 2025 to discuss the second quarter results beginning at 9:30 am eastern time. To listen to the call please dial (877) 407-7186 within the U.S. and Canada, or +1 (201) 689-8052 from other international locations. Participants should ask to be joined to the Tecogen Second Quarter conference call. Please begin dialing 10 minutes before the scheduled starting time. The earnings press release will be available on the Company website at www.Tecogen.com in the “News and Events” section under “About Us.” The earnings conference call will be webcast live. To view the associated slides, register for and listen to the webcast, go to https://ir.tecogen.com/ir-calendar. Following the call, the recording will be archived for 14 days.
The earnings conference call will be recorded and available for playback one hour after the end of the call. To listen to the playback, dial (877) 660-6853 within the U.S. and Canada, or (201) 612-7415 from other international locations and use Conference Call ID#: 13752231.
About Tecogen
Tecogen Inc. designs, manufactures, sells, installs, and maintains high efficiency, ultra-clean, cogeneration products including engine-driven combined heat and power, air conditioning systems, and high-efficiency water heaters for residential, commercial, recreational and industrial use. The company provides cost effective, environmentally friendly and reliable products for energy production that nearly eliminate criteria pollutants and significantly reduce a customer’s carbon footprint. In business for over 35 years, Tecogen has shipped more than 3,200 units, supported by an established network of engineering, sales, and service personnel in key markets in North America. For more information, please visit www.tecogen.com or contact us for a free Site Assessment.
Forward Looking Statements
This press release contains “forward-looking statements” which may describe strategies, goals, outlooks or other non-historical matters, or projected revenues, income, returns or other financial measures, that may include words such as “believe,” “expect,” “anticipate,” “intend,” “plan,” “estimate,” “project,” “target,” “potential,” “will,” “should,” “could,” “likely,” or “may” and similar expressions intended to identify forward-looking statements. These statements are only predictions and involve known and unknown risks, uncertainties, and other factors that may cause our actual results to differ materially from those expressed or implied by such forward-looking statements. Given these uncertainties, you should not place undue reliance on these forward-looking statements. Forward-looking statements speak only as of the date on which they are made, and we undertake no obligation to update or revise any forward-looking statements except as required under the securities laws.
In addition to those factors described in our Annual Report on Form 10-K, our Quarterly Reports on Form 10-Q and in our Current reports on Form 8-K, under “Risk Factors,” and elsewhere therein, among the factors that could cause actual results to differ materially from past and projected future results are the following: fluctuations in demand for our products and services, competing technological developments, issues relating to research and development, the availability of incentives, rebates, and tax benefits relating to our products and services, changes in the regulatory environment relating to our products and services, integration of acquired business operations, the impact of tariffs, and the ability to obtain financing on favorable terms to fund existing operations and anticipated growth.
In addition to GAAP financial measures, this press release includes certain non-GAAP financial measures, including adjusted EBITDA which excludes certain expenses as described in the presentation. We use Adjusted EBITDA as an internal measure of business operating performance and believe that the presentation of non-GAAP financial measures provides a meaningful perspective of the underlying operating performance of our current business and enables investors to better understand and evaluate our historical and prospective operating performance by eliminating items that vary from period to period without correlation to our core operating performance and highlights trends in our business that may not otherwise be apparent when relying solely on GAAP financial measures.
TECOGEN INC. CONDENSED CONSOLIDATED BALANCE SHEETS (unaudited)
June 30, 2025
December 31, 2024
ASSETS
Current assets:
Cash and cash equivalents
$
1,640,864
$
5,405,233
Accounts receivable, net
6,640,483
6,026,545
Inventories, net
9,679,229
9,634,005
Unbilled revenue
126,738
398,898
Prepaid and other current assets
949,256
680,565
Total current assets
19,036,570
22,145,246
Long-term assets:
Property, plant and equipment, net
1,820,059
1,738,036
Right-of-use assets – operating leases
1,728,780
1,730,358
Right-of-use assets – finance leases
933,671
452,390
Intangible assets, net
2,330,959
2,513,189
Goodwill
2,346,566
2,346,566
Other assets
155,232
166,474
TOTAL ASSETS
$
28,351,837
$
31,092,259
LIABILITIES AND STOCKHOLDERS’ EQUITY
Current liabilities:
Related party notes, current portion
$
–
$
1,548,872
Accounts payable
4,946,218
4,142,678
Accrued expenses
2,976,211
2,890,886
Deferred revenue, current portion
4,420,644
6,701,131
Operating lease obligations, current portion
481,891
430,382
Finance lease obligations, current portion
173,362
85,646
Acquisition liabilities, current portion
883,541
902,552
Unfavorable contract liability, current portion
83,962
113,449
Total current liabilities
13,965,829
16,815,596
Long-term liabilities:
Related party notes, net of current portion
1,067,848
–
Deferred revenue, net of current portion
1,252,831
1,165,951
Operating lease obligations, net of current portion
1,295,450
1,341,789
Finance lease obligations, net of current portion
675,198
325,235
Acquisition liabilities, net of current portion
878,151
1,008,760
Unfavorable contract liability, net of current portion
275,079
309,390
Total liabilities
19,410,386
20,966,721
Commitments and contingencies
Stockholders’ equity:
Tecogen Inc. stockholders’ equity:
Common stock, $0.001 par value; 100,000,000 shares authorized; 25,571,490 issued and outstanding at June 30, 2025 and 24,950,261 shares issued and outstanding at December 31, 2024
25,571
24,950
Additional paid-in capital
58,837,181
57,845,289
Accumulated deficit
(49,763,921
)
(47,639,894
)
Total Tecogen Inc. stockholders’ equity
9,098,831
10,230,345
Non-controlling interest
(157,380
)
(104,807
)
Total stockholders’ equity
8,941,451
10,125,538
TOTAL LIABILITIES AND STOCKHOLDERS’ EQUITY
$
28,351,837
$
31,092,259
TECOGEN INC. CONDENSED CONSOLIDATED STATEMENTS OF OPERATIONS (unaudited)
Three Months Ended
June 30, 2025
June 30, 2024
Revenues
Products
$
3,155,323
$
119,673
Services
3,965,168
4,126,517
Energy production
174,329
481,597
Total revenues
7,294,820
4,727,787
Cost of sales
Products
2,232,155
171,982
Services
2,469,737
2,191,815
Energy production
130,436
284,835
Total cost of sales
4,832,328
2,648,632
Gross profit
2,462,492
2,079,155
Operating expenses:
General and administrative
3,091,175
2,897,993
Selling
514,735
405,277
Research and development
268,724
246,489
(Gain) loss on disposition of assets
(280
)
3,363
Total operating expenses
3,874,354
3,553,122
Loss from operations
(1,411,862
)
(1,473,967
)
Other income (expense)
Other income (expense), net
(6,378
)
18,894
Interest expense
(38,153
)
(17,869
)
Unrealized loss on investment securities
–
(37,497
)
Total other income (expense), net
(44,531
)
(36,472
)
Loss before provision for state income taxes
(1,456,393
)
(1,510,439
)
Provision for state income taxes
16,762
37
Consolidated net loss
(1,473,155
)
(1,510,476
)
(Income) loss attributable to the non-controlling interest
9,050
(28,320
)
Loss attributable to Tecogen Inc.
$
(1,464,105
)
$
(1,538,796
)
Net loss per share – basic
$
(0.06
)
$
(0.06
)
Weighted average shares outstanding – basic
25,250,217
24,850,261
Net loss per share – diluted
$
(0.06
)
$
(0.06
)
Weighted average shares outstanding – diluted
25,250,127
24,850,261
Three Months Ended
June 30, 2025
June 30, 2024
Non-GAAP financial disclosure (1)
Net loss attributable to Tecogen Inc.
$
(1,464,105
)
$
(1,538,796
)
Interest expense, net
38,153
17,869
Income taxes
16,762
37
Depreciation & amortization, net
205,686
141,361
EBITDA
(1,203,504
)
(1,379,529
)
Stock based compensation
42,606
45,463
Unrealized loss on investment securities
–
37,497
Adjusted EBITDA
$
(1,160,898
)
$
(1,296,569
)
(1) Non-GAAP Financial Measures
In addition to reporting net income, a U.S. generally accepted accounting principle (“GAAP”) measure, this news release contains information about Adjusted EBITDA (net income (loss) attributable to Tecogen Inc adjusted for interest, income taxes, depreciation and amortization, stock-based compensation expense, unrealized gain or loss on investment securities, goodwill impairment charges and other non-cash non-recurring charges including abandonment of certain intangible assets), which is a non-GAAP measure. The Company believes Adjusted EBITDA allows investors to view its performance in a manner similar to the methods used by management and provides additional insight into its operating results. Adjusted EBITDA is not calculated through the application of GAAP. Accordingly, it should not be considered as a substitute for the GAAP measure of net income and, therefore, should not be used in isolation of, but in conjunction with, the GAAP measure. The use of any non-GAAP measure may produce results that vary from the GAAP measure and may not be comparable to a similarly defined non-GAAP measure used by other companies.
TECOGEN INC. CONDENSED CONSOLIDATED STATEMENTS OF OPERATIONS (unaudited)
Six Months Ended
June 30, 2025
June 30, 2024
Revenues
Products
$
5,689,132
$
1,611,071
Services
8,210,190
8,140,827
Energy production
673,268
1,161,985
Total revenues
14,572,590
10,913,883
Cost of sales
Products
3,719,905
1,221,525
Services
4,728,635
4,284,072
Energy production
440,518
753,475
Total cost of sales
8,889,058
6,259,072
Gross profit
5,683,532
4,654,811
Operating expenses:
General and administrative
6,019,310
5,746,559
Selling
1,109,216
934,946
Research and development
561,392
501,185
Gain on sale of assets
(280
)
(4,028
)
Total operating expenses
7,689,638
7,178,662
Loss from operations
(2,006,106
)
(2,523,851
)
Other income (expense)
Other income (expense), net
(20,623
)
3,147
Interest expense
(70,479
)
(36,539
)
Unrealized loss on investment securities
(18,749
)
(18,749
)
Total other income (expense), net
(109,851
)
(52,141
)
Loss before provision for state income taxes
(2,115,957
)
(2,575,992
)
Provision for state income taxes
17,687
22,100
Consolidated net loss
(2,133,644
)
(2,598,092
)
(Income) loss attributable to non-controlling interest
9,617
(45,671
)
Net loss attributable to Tecogen Inc.
$
(2,124,027
)
$
(2,643,763
)
Net loss per share – basic
$
(0.08
)
$
(0.11
)
Weighted average shares outstanding – basic
25,103,388
24,850,261
Net loss per share – diluted
$
(0.08
)
$
(0.11
)
Weighted average shares outstanding – diluted
25,103,388
24,850,261
Six Months Ended
June 30, 2025
June 30, 2024
Non-GAAP financial disclosure (1)
Net loss attributable to Tecogen Inc.
$
(2,124,027
)
$
(2,643,763
)
Interest expense, net
70,479
36,539
Income taxes
17,687
22,100
Depreciation & amortization, net
391,381
281,498
EBITDA
(1,644,480
)
(2,303,626
)
Stock based compensation
83,439
89,998
Unrealized loss on marketable securities
18,749
18,749
Adjusted EBITDA
$
(1,542,292
)
$
(2,194,879
)
(1) Non-GAAP Financial Measures
In addition to reporting net income, a U.S. generally accepted accounting principle (“GAAP”) measure, this news release contains information about Adjusted EBITDA (net income (loss) attributable to Tecogen Inc adjusted for interest, income taxes, depreciation and amortization, stock-based compensation expense, unrealized gain or loss on investment securities, goodwill impairment charges and other non-cash non-recurring charges including abandonment of certain intangible assets), which is a non-GAAP measure. The Company believes Adjusted EBITDA allows investors to view its performance in a manner similar to the methods used by management and provides additional insight into its operating results. Adjusted EBITDA is not calculated through the application of GAAP. Accordingly, it should not be considered as a substitute for the GAAP measure of net income and, therefore, should not be used in isolation of, but in conjunction with, the GAAP measure. The use of any non-GAAP measure may produce results that vary from the GAAP measure and may not be comparable to a similarly defined non-GAAP measure used by other companies.
TECOGEN INC. CONDENSED CONSOLIDATED STATEMENTS OF CASH FLOWS (unaudited)
Six Months Ended
June 30, 2025
June 30, 2024
CASH FLOWS FROM OPERATING ACTIVITIES:
Consolidated net loss
$
(2,133,644
)
$
(2,598,092
)
Adjustments to reconcile net loss to net cash provided by (used in) operating activities:
Depreciation and amortization
391,381
281,498
Provision for (recovery of) credit losses
(75,000
)
19,063
Stock-based compensation
83,439
89,998
Unrealized loss on investment securities
18,749
18,749
Gain on disposition of assets
(280
)
(4,028
)
Non-cash interest expense
33,538
12,800
Changes in operating assets and liabilities
(Increase) decrease in:
Accounts receivable
(538,938
)
1,398,193
Inventory
(45,224
)
439,926
Unbilled revenue
272,160
–
Prepaid assets and other current assets
(268,691
)
(125,784
)
Other assets
186,766
576,926
Increase (decrease) in:
Accounts payable
803,540
(108,646
)
Accrued expenses and other current liabilities
85,325
39,838
Deferred revenue
(2,193,607
)
806,266
Other liabilities
(395,134
)
(756,410
)
Net cash provided by (used in) operating activities
(3,775,620
)
90,297
CASH FLOWS FROM INVESTING ACTIVITIES:
Purchases of property and equipment
(277,989
)
(556,636
)
Proceeds from disposition of assets
280
36,213
Distributions to non-controlling interest
(42,956
)
(48,654
)
Net cash used in investing activities
(320,665
)
(569,077
)
CASH FLOWS FROM FINANCING ACTIVITIES:
Finance lease principal payments
(63,010
)
(30,577
)
Proceeds from exercise of stock options
394,926
–
Net cash provided (used in) by financing activities
331,916
(30,577
)
Net increase (decrease) in cash and cash equivalents
(3,764,369
)
(509,357
)
Cash and cash equivalents, beginning of the period
5,405,233
1,351,270
Cash and cash equivalents, end of the period
$
1,640,864
$
841,913
Supplemental disclosure of cash flow information:
Cash paid for interest
$
36,526
$
22,909
Cash paid for taxes
$
17,687
$
22,100
Non-cash investing activities
Right-of-use assets acquired under operating leases
At the recent Empower Collaboration event held August 3–6, Sacred Journey Recovery took center stage in a robust conversation around men’s mental health and addiction recovery. Hosted at the intersection of innovation and wellness, the event brought together pioneers in behavioral health, recovery, neuroscience, and holistic well-being. Among a distinguished lineup of presenters, including transformational leaders and behavioral health innovators, Sacred Journey Recovery’s presence underscored the center’s rising profile in the national conversation surrounding men’s substance use and mental health treatment.
The Empower Collaboration, known for creating a platform where heart-led professionals come together to inspire collective change, attracted hundreds of clinicians, coaches, trauma experts, and advocates. Keynote voices such as David Meltzer, a globally recognized entrepreneur and humanitarian, set the tone for a weekend rooted in purpose, transformation, and unity. Meltzer, who has long championed mental health and service as a business cornerstone, shared the stage with leaders like Rachel Graham, founder of Healing Springs Ranch, and Dr. Josh Schwarzbaum, an ER physician focused on trauma-informed care. Each presentation served as a call to action to rethink behavioral health from a multidimensional lens, merging clinical excellence, community-based healing, and personal purpose.
Sacred Journey Recovery contributed to this dialogue by presenting its trailblazing Wolf Therapy initiative. This program has captured attention for its deep therapeutic impact on men healing from substance use disorders and co-occurring trauma. Unlike traditional talk therapy alone, Sacred Journey’s Wolf Therapy sessions leverage the nonverbal, intuitive presence of socialized wolves to help clients confront fears, reconnect to their own power, and rewire patterns of detachment. The wolves, provided in collaboration with the Wolf Education Project, are not only symbols of strength and survival but also partners in the recovery process. When clients come face to face with these majestic animals, it invites them into an encounter that bypasses intellectual defenses and awakens emotional truth.
This program is part of Sacred Journey Recovery’s broader model, which incorporates evidence-based addiction treatment practices such as Dialectical Behavioral Therapy (DBT), Cognitive Behavioral Therapy (CBT), Acceptance and Commitment Therapy (ACT), and Narrative Therapy. Unlike conventional facilities, Sacred Journey interweaves these modalities into real-world experience through adventure therapy, wilderness outings, rites of passage weekends, and brotherhood-based peer support. Based in Vista, California, the center provides a safe space where men are called into deeper self-awareness, radical honesty, and transformative accountability.
As the nation confronts an epidemic of fentanyl, methamphetamine, alcohol, and prescription drug abuse—especially among men who have long felt disconnected from traditional therapeutic models—Sacred Journey is positioning itself as a leader in experiential, masculine-centered recovery. The Empower Collaboration was a fitting venue for this work to be highlighted. At a time when many are questioning the efficacy of outdated treatment systems, the event made it clear that innovation is not only welcome—it is essential.
CEO Drew Anagnostou shared his appreciation for the experience, stating, “We are so grateful to be here at the Empower Collaboration event. Being able to share the stage with amazing thought leaders in the space is humbling and invigorating. Sacred Journey Recovery is poised to bring clinical excellence with holistic healing to men across the United States, based right here in Vista, California. We aim to help men reconnect with their authentic masculinity through outdoor-based adventure therapy, while also leveraging industry-leading technologies like Brain Mapping and cutting-edge therapies.”
With the national spotlight growing brighter on men’s mental health and substance use, Sacred Journey Recovery’s participation in the Empower Collaboration signals that the field is evolving. The presence of wolves in a therapeutic setting may seem unconventional to some, but for those in recovery at Sacred Journey, it is just one of many life-changing encounters on the path to wholeness. As conversations from the August event ripple across the behavioral health landscape, Sacred Journey Recovery remains at the forefront, committed to redefining what meaningful, masculine, and sustainable recovery truly looks like.
NoRepairCost.com, well-known for its role in the RV warranty sector, has announced a new pricing plan that offers some of the lowest prices for extended RV warranties. With over 30 years in the business, NoRepairCost.com has built its strong reputation on being reliable, clear about what they offer, and delivering exceptional customer service. The company’s services, backed by AM Best A Rated Financial Institutions, include comprehensive RV extended warranties and options for free custom quotes available for all types of recreational vehicles. This new pricing structure reinforces their dedication to protecting the financial investments of RV owners from pricey repair bills, while also raising the standard for quality service.
NoRepairCost.com is making extended warranties more reachable for a wider group of RV owners with this pricing adjustment. This initiative responds to a rising demand for more budget-friendly and flexible coverage as repair costs are on the rise. With their commitment to “Lowest Prices,” NoRepairCost.com lessens the financial pressure faced by RV lovers and strengthens its leading position in the industry.
“Our aim has always been to give our customers the finest coverage without breaking the bank,” says Cory Grant, CEO of NoRepairCost.com. As highlighted in their blog, which includes posts about RV warranties, traveling full-time in an RV with kids, and choosing between budget and luxury RV experiences, “With these new rates, we can offer our policies at the lowest rates available, while ensuring our customers benefit from the best customer service around. We believe this strategy establishes a new benchmark in the RV warranty business, combining financial safeguards with outstanding service.”
This updated pricing strategy is a part of NoRepairCost.com’s ongoing mission to deliver great value across its services, providing broad coverage for components like engines, transmissions, air conditioning, and more. The warranties they offer are backed by AM Best A Rated Financial Institutions, giving RV owners an extra level of assurance.
One standout feature of NoRepairCost.com’s service is the flexibility it provides policyholders. Customers can choose any licensed service center across the U.S. or Canada for repairs, which adds convenience and adaptability that’s not often found in the field. Additionally, the option to transfer or cancel warranties with ease gives extra value, especially for those thinking about selling their RVs. The company’s BBB Accreditation and A+ Rating further attest to their commitment to quality and customer satisfaction.
A key part of NoRepairCost.com’s business approach is its top-level customer service. The company takes pride in its excellent rating, with customer feedback often praising their responsive and well-informed support team. This focus on customer happiness is central to NoRepairCost.com’s commitment to providing the Best Customer Service, a value that’s echoed through their many positive reviews. Many clients highlight the professionalism and dedication of the team, which aligns perfectly with the company’s mission to go beyond customer expectations.
Cory Grant also mentions, “Besides reducing costs, we’ve simplified our claims process to be as free from hassles as possible. This strengthens our service, making sure every interaction leaves our clients feeling secure and supported. We understand choosing an RV warranty is a major decision, and we want to make it as smooth and reassuring as we can.”
Besides the new pricing plan, NoRepairCost.com continues to enhance customer relations through its RV-focused blog and lifestyle newsletter. These platforms provide insights and advice for RV travelers, helping to create a community centered around shared passions and experiences in the RV lifestyle.
In their forward-looking approach, NoRepairCost.com has been growing its presence on social media, connecting with wider audiences and directly engaging with the RV community. This tactic shows the company’s commitment to staying timely and attentive to customer needs in today’s changing market.
NoRepairCost.com’s all-encompassing approach, from offering cost-effective warranty solutions to highlighting first-rate customer service, represents a major step forward in the company’s journey. By focusing on providing affordable options along with great service, NoRepairCost.com is set to lead changes in the industry, making RV extended warranties more accessible and reliable.
Through these recent changes, NoRepairCost.com remains committed to protecting RV owners while building a service model that is both customer-focused and budget-friendly. As RV fans head into 2024, the company’s newly improved pricing and service strategies ensure they remain a trusted partner for RV protection nationwide.
All In Solutions Counseling Center in Boynton Beach has announced that they are expanding their mental health and addiction treatment services. This move is a response to the growing need for support in mental health, addiction recovery, and wellness services in the community. By broadening their services, the center aims to offer more help to those who need professional care.
There’s been a noticeable rise in the demand for mental health services, as more people seek help for issues like anxiety, depression, and substance abuse. To meet this increasing need, the All In Solutions Counseling Center in Boynton Beach is adding more therapy options, specialized programs, and more appointment times. This is part of their effort to better serve community needs.
“We are committed to offering a wide range of treatment options tailored to the unique challenges our clients face,” said a representative from All In Solutions Counseling Center. “By expanding our services, we hope to provide support that fosters healing and growth for our community.”
As part of the expansion, the center is offering new individual and group therapy sessions, specialized workshops, and support groups for different mental health conditions and addiction issues. These new services aim to offer more personalized care and address specific patient needs. Details about their comprehensive medical detox, residential treatment, and other offerings can also be explored on their official website.
The mental health professionals at the center use evidence-based practices designed to promote recovery and long-term wellness. The programs rely on the latest research and clinical practices to ensure that clients receive high-quality care.
In addition, the center is launching a series of community outreach initiatives to raise awareness about mental health and addiction. These initiatives focus on educating the community and reducing the stigma associated with seeking treatment. The center values community involvement and encourages residents to join open forums, workshops, and events to talk about mental health topics.
“The launch of our community outreach programs is an important step in making mental health resources more accessible and reducing societal stigma,” said another representative from All In Solutions Counseling Center. “Our hope is that by providing these tools and information, we can empower individuals to seek the help they need.”
This latest expansion is a reflection of the center’s ongoing dedication to offering diverse and accessible mental health and addiction treatment services. Their wide range of programs and focus on community engagement show their commitment to being a resource for those seeking support. They demonstrate their continued investment in the community’s well-being.
The center’s welcoming atmosphere and experienced staff are ready to support individuals on their journey toward recovery and improvement. With new therapy services, increased community engagement, and educational resources, All In Solutions Counseling Center in Boynton Beach remains dedicated to enhancing the lives of those they serve. As they continue to grow, their goal is to provide comprehensive treatment that encourages wellness and recovery. Visit their site to learn more about integrated family therapy, trauma-focused treatment, and other supportive services they offer.
Hillside Metal, known for its strong presence in Western New York and Eastern Pennsylvania, has announced exciting updates to its product offerings and customer service strategies. This family-owned business, led by Andy Miller and his sons, has long focused on providing top-quality steel roofing and siding products at competitive prices. Now, Hillside Metal has expanded its range to include more standard metal roofing panels, standing seam metal roofing, metal siding, pole barn kits, and hardware supplies. The goal is to meet the diverse needs of both contractors and homeowners.
Adding these new product lines shows how much Hillside Metal wants to be a leading supplier in the building materials industry. By cutting out the middleman, the company ensures that customers can access high-quality products made in-house, emphasizing their dedication to offering both quality and value. The ordering process at Hillside Metal is very efficient, often allowing them to deliver most roofing materials within two days, which is particularly helpful for contractors working under tight schedules.
Hillside Metal has also made big improvements in customer service, which they see as central to maintaining their community relationships. “At Hillside Metal, our customers are at the heart of every decision we make,” said Roy Miller, a representative from the company. “By expanding our product lines and refining our ordering process, we are better equipped to support our community’s building projects effectively and efficiently.”
The company offers metal roofing options suitable for different climates and architectural styles, whether it’s residential, commercial, or agricultural. Hillside Metal uses high-grade steel to ensure durability, which is especially valued by customers dealing with tough weather conditions. Their standing seam metal roofing is not only sleek and modern but also provides extra protection against wind, rain, and snow with its smart interlocking design.
Hillside Metal is serious about long-lasting performance, and their metal siding options reflect this. Crafted from sturdy materials like steel, aluminum, and zinc, these sidings stand strong against rust, warping, and fading. Besides protecting a building, they are environmentally friendly since these materials are recyclable, aligning with sustainability goals.
Beyond roofing and siding, Hillside Metal’s pole barn kits are notable for their versatility. These kits are ideal for various needs, from agricultural to residential and commercial. They are designed for quick and simple assembly, catering to those who need dependable buildings in tough conditions.
Online, Hillside Metal uses its digital platforms to interact with current and potential customers. Their Hillside Metal Facebook page is a key site for sharing updates and connecting with followers. Customer opinions, shared through Hillside Metal reviews, highlight the company’s focus on service excellence and strengthen its good standing in the industry.
Roy Miller shared, “Our presence online, especially through platforms like Hillside Metal Facebook, allows us to engage directly with our community. Listening and responding to Hillside Metal reviews helps us better understand customer needs and continue to provide top-notch service.”
Hillside Metal’s hardware supplies add to their roofing and siding products by offering all the necessary parts for smooth installation and upkeep. By providing reliable materials, they make it easier for customers to handle roof repairs and maintenance, which many customers see as a major plus.
Hillside Metal’s continuous efforts to improve its products and services underline its commitment to quality and customer satisfaction. As the industry changes, Hillside Metal remains dedicated to offering valuable solutions tailored to the unique roofing and building needs of their customers.
Digital Bullet Agency is making big moves in the U.S., growing its reach in the AI-driven marketing world. This agency stands out for how it uses AI to boost search engine optimization (SEO), helping real estate investors and agencies strengthen their hold locally. The goal of this expansion is to make their expertise available to more businesses, using advanced AI tools and strategies to amp up digital visibility.
This move follows Digital Bullet’s latest acquisition of REIPilot.ai. This exciting addition is set to boost the agency’s operations, promising better efficiency and more value for their clients. By weaving in cutting-edge technology, Digital Bullet Agency aims to cement its role as a frontrunner in the industry, enhancing their ability to provide full-service SEO solutions that pack a punch.
Keith Dean, a familiar face in the digital marketing scene and a key representative at Digital Bullet Agency, shared his thoughts on this growth. “Our expansion into the U.S. market is a testament to our commitment to delivering top-tier AI-enhanced SEO services,” Dean noted. “We’re always on the hunt to grow our capabilities, and acquiring REIPilot.ai marks an exciting step for us.”
Over the last decade, Digital Bullet Agency has earned a strong reputation for offering effective, data-driven SEO strategies. By tapping into AI technology, the agency crafts tailored marketing approaches that meet each client’s unique needs. Their services include developing comprehensive SEO strategies, creating content that appeals to both search engines and people, and offering specialized video SEO services. These services give businesses practical insights to boost their rankings, increase traffic, and drive conversions.
Digital Bullet Agency is transforming the usual SEO techniques by integrating AI in smart ways. By doing so, they not only enhance human expertise but also encourage strategic and creative thinking amongst their team. This mix of human and AI input leads to a more effective marketing process, bringing continuous improvements from AI insights.
With the tools and processes at their website, businesses can tap into the potential of digital marketing to better engage with their audiences. In today’s business world, having a strong digital presence is crucial, especially as more interactions and engagements go online. Digital Bullet Agency offers three distinct monthly packages—Starter, Most Popular, and Enterprise—to suit businesses of different sizes and goals.
Their presence on LinkedIn further underscores Digital Bullet Agency’s role as a leader in digital marketing. Visit their LinkedIn page at https://uk.linkedin.com/in/digitalbulletagency for more details about the agency’s significant accomplishments and its team’s dedication to service excellence.
Keith Dean shared more about the agency’s mission. “Our mission is to empower businesses with the capabilities they need to thrive in a competitive digital environment,” Dean explained. “Expanding our reach isn’t just about covering more ground; it’s about exploring new tech and partnerships that can offer incredible benefits.”
Looking ahead, Digital Bullet Agency is set on being a game-changer in digital marketing. Their current path positions them to bring advanced SEO solutions and AI applications to businesses wanting to make a big impact online. The U.S. expansion, combined with the REIPilot.ai acquisition, is a major step forward in the agency’s mission to deliver top-notch results and help clients succeed globally. Explore how their innovative AI-driven SEO services can make a difference in any business at https://digitalbulletagency.com/.
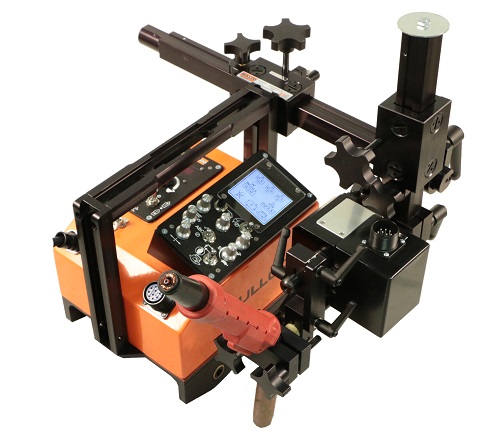
Gullco International, a leading manufacturer of welding automation equipment, announces the continued success of mechanized welding solutions in transforming fabrication operations across multiple industries. With over seventy years of specialized expertise in welding technology, the company has established itself as a trusted provider of automated welding carriages, tractors, and custom systems that enable fabricators to achieve superior weld quality while significantly reducing production timeframes compared to traditional manual welding processes.
In many fabrication environments, manual welding inconsistencies can severely limit throughput and profitability. The prevalence of defects like undercut, poor fusion, and porosity often necessitate costly rework, consuming labor hours that could be billed elsewhere. Gullco International understands that every minute spent grinding or repairing welds not only causes delays but also wastes expensive consumables, directly impacting a company’s bottom line. Mechanized welding solutions, with their precise control over torch angle and travel speed, address these issues head-on by significantly reducing the need for repairs, helping fabricators keep projects on schedule and under budget.
Project deadlines are frequently compromised due to the limitations of manual welding, making arc-on time a critical bottleneck. When welders must frequently pause to reposition the torch or recover from fatigue, productivity stalls. Gullco’s mechanized carriages and tractors maintain a consistent welding speed along seams, particularly beneficial on long or complex welds. This steady performance increases arc-on time, enabling fabricators to meet tight deadlines and secure contracts that require reliable and timely completions. By improving operational efficiency, mechanized welding eliminates the domino effect that delays can cause throughout the production chain.
Operator safety remains a paramount concern in welding shops worldwide. The demanding conditions of manual welding—exposure to intense heat, hazardous fumes, and prolonged awkward postures—contribute to both long-term health risks and day-to-day operator fatigue. Gullco International’s mechanized welding solutions protect operators by distancing them from direct arc exposure and reducing ergonomic strain, ensuring both safety and sustained weld quality. This dual benefit fosters a healthier workforce and diminishes accident risks, directly translating to improved morale and lower downtime.
One cornerstone of Gullco’s offering is the KAT® Automation Carriage, a rugged and versatile device capable of handling all-position welding. Whether working vertically, horizontally, or overhead, this carriage maintains flawless torch positioning and speed, thereby removing operator strain and delivering repeatable welds on the most challenging joints. Whether fabricating structural steel components or erecting a tank or ship hull, the KAT® serves as a reliable partner to skilled welders, allowing them to focus on crucial adjustments rather than manual control.
Adopting mechanized welding solutions is not merely an upgrade in equipment; it’s an investment in operational excellence that pays dividends through reduced rework, higher throughput, and improved weld quality and safety. Gullco International provides a seamless process for fabricators to integrate mechanization into their workflows, starting with a consultation to understand specific requirements. The company’s application experts then recommend the precise equipment package that delivers the fastest return on investment and the greatest competitive advantage.
Jeff Zook, Director at Gullco International, emphasizes the company’s dedication to helping fabricators thrive in a challenging market. “Our mission has always been to empower welding professionals by providing mechanized tools that complement their craftsmanship. We know that precision, efficiency, and safety are non-negotiable and strive to deliver equipment that supports these values, enabling shops to produce perfect welds reliably and on schedule,” Zook stated.
As industries evolve and fabrication demands grow increasingly complex, mechanized welding solutions by Gullco International represent a proven path forward. These systems bridge the gap between manual welding’s flexibility and full automation’s rigidity, offering fabricators a balance of control and consistency. The result is a more efficient, profitable, and safer workplace that can confidently meet today’s production challenges and win tomorrow’s jobs.
Fabricators continuing with manual welding alone risk falling behind competitors, suffering from chronic rework, delays, and lost contracts. Embracing Gullco’s mechanized welding technology is a strategic choice that protects profitability, reputation, and workforce wellbeing. By leveraging equipment trusted on the world’s most demanding jobsites, fabricators gain an undeniable advantage in quality, speed, and safety that helps secure long-term success in a competitive landscape.
Gullco International remains committed to partnering with fabricators worldwide, delivering expert support and industry-renowned mechanized welding solutions that unlock new levels of productivity and quality. Through dedication to innovation and customer success, Gullco’s solutions continue to set the standard for mechanized welding excellence that fabricators can depend on every day.
MCLEAN, VA / ACCESS Newswire / August 12, 2025 / Gladstone Investment Corporation (Nasdaq:GAIN) (the “Company”) today announced earnings for its first fiscal quarter ended June 30, 2025. Please read the Company’s Quarterly Report on Form 10-Q, filed today with the U.S. Securities and Exchange Commission (the “SEC”), which is available on the SEC’s website at www.sec.gov or the investors section of the Company’s website at www.gladstoneinvestment.com.
Summary Information: (dollars in thousands, except per share data (unaudited)):
June 30, 2025
March 31, 2025
$
Change
%
Change
For the quarter ended:
Total investment income
$
23,544
$
27,548
$
(4,004
)
(14.5
)%
Total expenses, net (A)
14,456
20,319
(5,863
)
(28.9
)%
Net investment income (A)
9,088
7,229
1,859
25.7
%
Net realized gain
–
20,879
(20,879
)
(100.0
)%
Net unrealized depreciation
(1,316
)
(10,235
)
8,919
(87.1
)%
Net increase in net assets resulting from operations (A)
$
7,772
$
17,873
$
(10,101
)
(56.5
)%
Net investment income per weighted-average common share (A)
$
0.25
$
0.20
$
0.05
25.0
%
Adjusted net investment income per weighted-average common share (B)
$
0.24
$
0.26
$
(0.02
)
(7.7
)%
Net increase in net assets resulting from operations per weighted-average common share (A)
$
0.21
$
0.49
$
(0.28
)
(57.1
)%
Cash distribution per common share from net investment income (C)
$
0.27
$
–
$
0.27
NM
Cash distribution per common share from net realized gains (C)
$
0.51
$
0.24
$
0.27
112.5
%
Weighted-average yield on interest-bearing investments
14.1
%
13.2
%
0.9
%
6.8
%
Total dollars invested
$
62,842
$
14,024
$
48,818
348.1
%
Total dollars repaid and collected from sales and recapitalization of investments
$
4,370
$
117,579
$
(113,209
)
(96.3
)%
Weighted-average shares of common stock outstanding – basic and diluted
36,908,943
36,837,381
71,562
0.2
%
Total shares of common stock outstanding
37,352,676
36,837,381
515,295
1.4
%
As of:
Total investments, at fair value
$
1,036,745
$
979,320
$
57,425
5.9
%
Fair value, as a percent of cost
103.9
%
104.3
%
(0.4
)%
(0.4
)%
Net assets
$
485,304
$
499,084
$
(13,780
)
(2.8
)%
Net asset value per common share
$
12.99
$
13.55
$
(0.56
)
(4.1
)%
Number of portfolio companies
27
25
2
8.0
%
NM = Not Meaningful
(A) Inclusive of $0.2 million, or $0.01 per weighted-average common share, of capital gains-based incentive fees reversed during the three months ended June 30, 2025 and $2.1 million, or $0.06 per weighted-average common share, of capital gains-based incentive fees accrued during the three months ended March 31, 2025, respectively. These fees were accrued in accordance with United States generally accepted accounting principles (“U.S. GAAP”), where such amounts were not contractually due under the terms of the investment advisory agreement for the respective periods. Also see discussion under Non-GAAP Financial Measure – Adjusted Net Investment Income below. (B) See Non-GAAP Financial Measure – Adjusted Net Investment Income, below, for a description of this non-GAAP measure and a reconciliation from Net investment income to Adjusted net investment income, including on a weighted-average per share basis. The Company uses this non-GAAP financial measure internally in analyzing financial results and believes it is useful to investors as an additional tool to evaluate ongoing results and trends for the Company. (C) Estimates of tax characterization made on a quarterly basis may not be representative of the actual tax characterization of distributions for the full year. Estimates made on a quarterly basis are updated as of each interim reporting date.
Highlights for the Quarter: During the quarter ended June 30, 2025, the following significant events occurred:
Portfolio Activity:
In May 2025, we invested $49.5 million in a new portfolio company, Smart Chemical Solutions, LLC (“Smart Chemical”), in the form of $35.7 million of secured first lien debt and $13.8 million of preferred equity. Smart Chemical, headquartered in Midland, Texas, is a leading provider of production chemicals for onshore oil and gas operators throughout the United States.
In May 2025, we invested $12.8 million in a new portfolio company, Sun State Nursery and Landscaping, LLC (“Sun State”), in the form of $9.8 million of secured first lien debt and $3.1 million of preferred equity. Sun State, headquartered in Jacksonville, Florida, is a leading commercial landscaping installation and maintenance provider in the Jacksonville area.
In June 2025, we restructured our investment in PSI Molded Plastics, Inc. As a result of the restructuring, we converted debt with a cost basis of $10.6 million into preferred equity.
Distributions and Dividends:
Paid an $0.08 per common share distribution to common stockholders in each of April, May and June 2025; and
Paid a $0.54 per common share supplemental distribution to common stockholders in June 2025.
At-the-market (“ATM”) Program Activity:
Sold 515,295 shares of our common stock under our common stock ATM program at a weighted-average gross price of $14.23 per share and raised approximately $7.2 million in net proceeds. These sales were above our then-current estimated NAV per share.
First Quarter Results: Net investment income for the quarter ended June 30, 2025 was $9.1 million, or $0.25 per weighted-average common share, compared to net investment income of $7.2 million, or $0.20 per weighted-average common share, for the quarter ended March 31, 2025. This increase was a result of a decrease in total expenses, net of credits, primarily due to a decrease in accruals for capital gains-based incentive fees and income-based incentive fees, a decrease in interest expense and an increase in credits from Adviser, partially offset by a decrease in total investment income in the current quarter.
Total investment income for the quarters ended June 30, 2025 and March 31, 2025 was $23.5 million and $27.5 million, respectively. The decrease quarter over quarter was due to a $3.5 million decrease in success fee income and $0.7 million decrease in dividend income that did not reoccur in the current quarter as the timing of such fee income is variable. These decreases were partially offset by a $0.1 million increase in interest income primarily due to the collection of $1.5 million of past due interest from a portfolio company previously on non-accrual status in the current quarter.
Total expenses, net of credits, for the quarters ended June 30, 2025 and March 31, 2025 was $14.5 million and $20.3 million, respectively. The decrease quarter over quarter was primarily due to a $2.3 million decrease in accruals for capital gains-based incentive fees in the current quarter, as a result of the net impact of realized and unrealized gains and losses, a $2.3 million decrease in income-based incentive fees and a $0.5 million decrease in interest expense due to decreased borrowings on the credit facility. The decrease was also due to a $0.4 million increase in credits from Adviser.
Net asset value per common share as of June 30, 2025 was $12.99, compared to $13.55 as of March 31, 2025. The decrease quarter over quarter was primarily due to $28.8 million, or $0.78 per common share, of distributions paid to common shareholders and $1.3 million, or $0.04 per common share, of net unrealized depreciation on investments and other. These decreases were partially offset by $9.1 million, or $0.25 per common share, of net investment income and $0.01 per common share of net accretive effect of equity offering.
Subsequent Events: After June 30, 2025, the following significant events occurred:
Significant Investment Activity:
In July 2025, we invested $67.6 million in a new portfolio company, Global GRAB Technologies, Inc. (“Global GRAB”), in the form of $46.5 million of secured first lien debt and $21.1 million of preferred equity. Global GRAB, headquartered in Franklin, Tennessee, is a leading provider of turnkey perimeter security and hostile vehicle mitigation systems, serving various government and commercial organizations.
Distributions and Dividends:
In July 2025, our Board of Directors declared the following monthly distributions to common stockholders:
Record Date
Payment Date
Distribution per Common Share
July 21, 2025
July 31, 2025
$
0.08
August 20, 2025
August 29, 2025
0.08
September 22, 2025
September 30, 2025
0.08
Total for the Quarter:
$
0.24
ATM program activity:
Subsequent to June 30, 2025, we sold 866,554 shares of our common stock under our common stock ATM program at a weighted-average gross price of $14.14 per share and raised approximately $12.1 million in net proceeds. These sales were above our then-current estimated NAV per share.
Non-GAAP Financial Measure – Adjusted Net Investment Income: On a supplemental basis, the Company discloses Adjusted net investment income, including on a weighted-average per share basis, which is a financial measure that is calculated and presented on a basis of methodology other than in accordance with GAAP. Adjusted net investment income represents net investment income, excluding capital gains-based incentive fees. The Company uses this non-GAAP financial measure internally in analyzing financial results and believes that this non-GAAP financial measure is useful to investors as an additional tool to evaluate ongoing results and trends for the Company. The Company’s investment advisory agreement provides that a capital gains-based incentive fee is determined and paid annually with respect to realized capital gains (but not unrealized appreciation) to the extent such realized capital gains exceed realized capital losses and unrealized depreciation on investments for such year. However, under GAAP, a capital gains-based incentive fee is accrued if realized capital gains and unrealized appreciation of investments exceed realized capital losses and unrealized depreciation of investments. Refer to Note 4 – Related Party Transactions in our Quarterly Report on Form 10-Q for further discussion. The Company believes that Adjusted net investment income is a useful indicator of operations exclusive of any capital gains-based incentive fees, as net investment income does not include realized or unrealized investment activity associated with the capital gains-based incentive fee.
The following table provides a reconciliation of net investment income (the most comparable GAAP measure) to Adjusted net investment income for the periods presented (dollars in thousands, except per share amounts; unaudited):
For the quarter ended
June 30, 2025
March 31, 2025
Amount
Per Share
Amount
Amount
Per Share
Amount
Net investment income
$
9,088
$
0.25
$
7,229
$
0.20
Capital gains-based incentive fee
(209
)
(0.01
)
2,129
0.06
Adjusted net investment income
$
8,879
$
0.24
$
9,358
$
0.26
Weighted-average shares of common stock outstanding – basic and diluted
36,908,943
36,837,381
Adjusted net investment income may not be comparable to similar measures presented by other companies, as it is a non-GAAP financial measure that is not based on a comprehensive set of accounting rules or principles and therefore may be defined differently by other companies. In addition, Adjusted net investment income should be considered in addition to, not as a substitute for, or superior to, financial measures determined in accordance with GAAP.
Conference Call: The Company will hold its earnings release conference call on Wednesday, August 13, 2025, at 8:30 a.m. Eastern Time. Please call (866) 373-3416 to enter the conference call. An operator will monitor the call and set a queue for any questions. A replay of the conference call will be available through August 20, 2025. To hear the replay, please dial (877) 660-6853 and use the playback conference number 13754185. The replay will be available beginning approximately one hour after the call concludes. The live audio broadcast of the Company’s quarterly conference call will also be available online at www.gladstoneinvestment.com. The event will be archived and available for replay on the Company’s website.
About Gladstone Investment Corporation: Gladstone Investment Corporation is a publicly traded business development company that seeks to make secured debt and equity investments in lower middle market businesses in the United States in connection with acquisitions, changes in control and recapitalizations. Information on the business activities of all the Gladstone funds can be found at https://www.gladstonecompanies.com/.
To obtain a paper copy of our Quarterly Report on Form 10-Q, filed today with the SEC, please contact the Company at 1521 Westbranch Drive, Suite 100, McLean, VA 22102, ATTN: Investor Relations. The financial information above is not comprehensive and is without notes, so readers should obtain and carefully review the Company’s Form 10-Q for the quarter ended June 30, 2025, including the notes to the consolidated financial statements contained therein.
The statements in this press release regarding potential future distributions, earnings and operations of the Company are “forward-looking statements.” These forward-looking statements inherently involve certain risks and uncertainties in predicting future results and conditions. Although these statements are based on the Company’s current plans that are believed to be reasonable as of the date of this press release, a number of factors could cause actual results and conditions to differ materially from these forward-looking statements, including those factors described from time to time in the Company’s filings with the Securities and Exchange Commission. The Company undertakes no obligation to publicly release the result of any revisions to these forward-looking statements that may be made to reflect any future events or otherwise, except as required by law.